E-Commerce Cohort & Revenue Analytics
Customer Lifetime Value (LTV), RFM segmentation & basket affinity analysis across 500k+ transactions
the problem
An omnichannel retailer had rapid customer acquisition numbers but struggled with declining repeat purchase rates. Executive leadership had conflicting reports regarding customer acquisition cost (CAC) payback periods and could not determine which product bundles produced long-term brand loyalty.
approach & architecture
Wrote complex PostgreSQL queries utilizing Common Table Expressions (CTEs) and window functions (`DENSE_RANK`, `LAG`, `NTILE`) to calculate monthly retention cohorts across 500,000+ orders. Applied statistical clustering and RFM segmentation in Python to categorize users into 11 distinct personas. Built an interactive Tableau dashboard suite displaying lifetime value curves and cross-sell affinities.
system highlights
key features
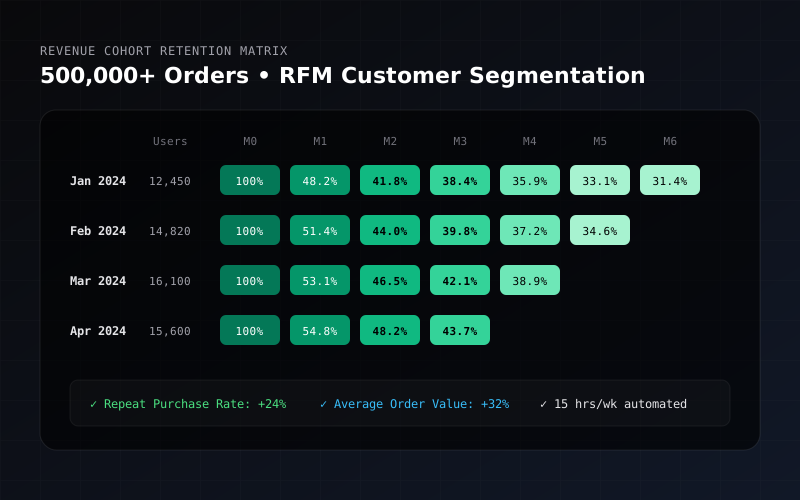
Dynamic Cohort Retention Heatmap
Visualizes month-over-month customer retention decay by acquisition channel and seasonal campaign.
RFM Persona Matrix
Segmented customer database enabling targeted email marketing campaigns customized for high-value VIPs versus re-engagement candidates.
Customer Lifetime Value (LTV) Trajectory
Projects cumulative revenue per cohort to calculate true payback windows and customer acquisition spend efficiency.
Cross-Selling Basket Affinities
Interactive scatter plots illustrating item co-purchase frequencies and lift ratios for merchandising teams.
technologies
outcomes & metrics
Delivered deep, actionable visibility into post-acquisition customer behavior, directly influencing inventory strategy and increasing high-margin repeat order frequency.
24% increase in repeat purchase rate following RFM campaign segmentation
32% higher average order value (AOV) on algorithmic bundle recommendations
Automated 15 hours/week of manual Excel reporting into an instant Tableau dashboard